Contact us
Contact us for more information 
Please fill out the form below and we will come back to you by email with more information on this product. If you have any questions or comments to PCH Engineering A/S, please do not hesitate to contact usBy using this form you agree with the storage and handling of your data by this website.
 
Name

Company

Product type, what can we do for you?


Phone

E-mail

Country


Please contact me
Please fill in the form and our local distributor will contact you as soon as possibl. By using this form you agree with the storage and handling of your data by this website.
 
Name

Company

Product type, what can we do for you?


Phone

E-mail

Country

  
Technical information
Text technical information...
 
Name

Company

Product type, what can we do for you?


Phone

E-mail

Country

  
top

PCH Vibration Studio - User Software for PCH Monitors

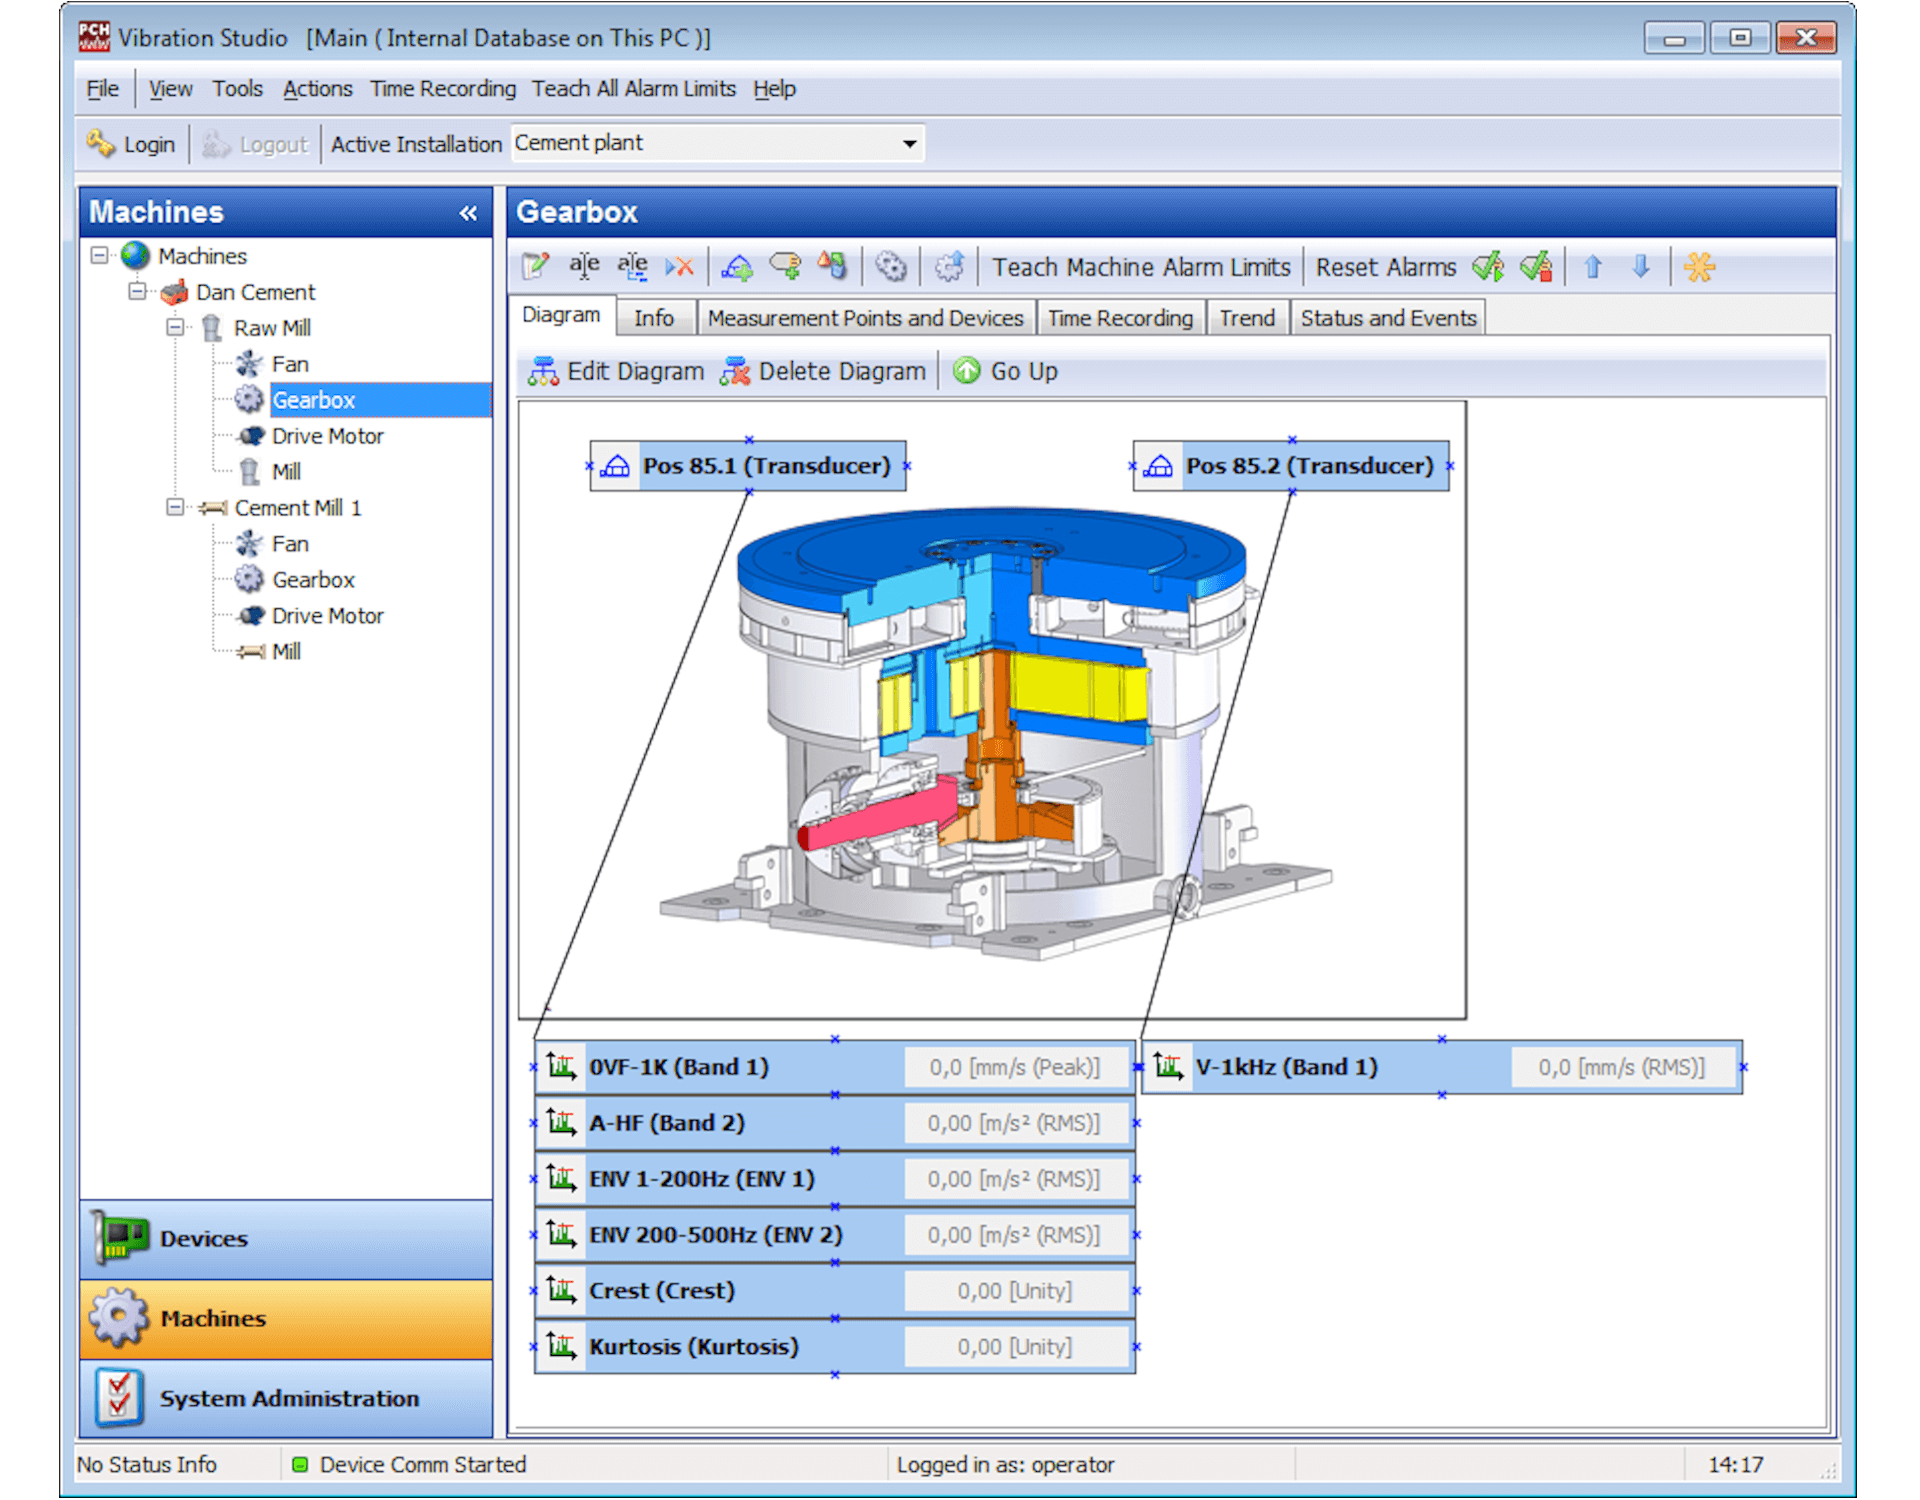
PCH Vibration Studio® is complementary user software for selected PCH vibration monitors.

PCH Vibration Studio® is used for easy overview, parametizing and back-up of settings of multiple PCH vibration monitors in a network.

The software offers continuous trending, time stream recording and an FFT diagnostics and analysis tool.

You can access your PCH vibration monitors using a standard computer either remotely through a network connection or directly through an RS-232/485 connection.

All vibration detectors and their levels are visualized when connected to your computer, and any active alarms are clearly seen.

The user software can be used for permanent monitoring or occasional checks or reserved for specialists only.


Contact
a consultant


Selected functions with PCH Vibration Studio

You can use the software for several daily tasks when handling your digital vibration monitors with RS-485 communication. Below are a few examples.


Parametizing PCH vibration monitors

PCH vibration monitors are factory configured.

If necessary, the user can change parameters like filter bands, measuring ranges and alarm levels through PCH Vibration Studio®.

Our bearing frequency calculator suggests filter bands for up to two Envelope detectors.

You simply select the type of bearing and rotating speed and the optimal filter band will be suggested (only available if supported by the PCH vibration monitor).

All parameters can be saved to a file for easy recovery or for loading into other PCH vibration monitors.


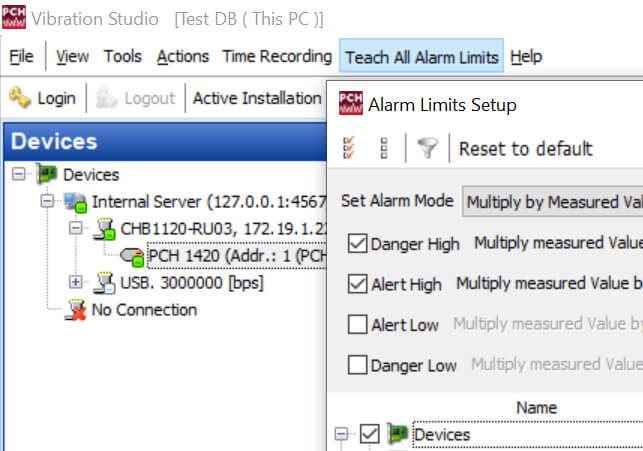
Teach function for easy alarm setting

All alarm settings can be configured based upon actual measured amplitudes.

Each alarm level can be calculated individually or a user defined general factor can be used.

With this tool you can set multiple alarm level from several vibration monitors in an easy and swift way.


Continuous trending from PCH Vibration Monitors

If PCH Vibration Studio® is permanently monitoring one or more vibration monitors, trend scalar values can be stored and viewed on the computer.

Several detectors can be shown in the same scalar chart from any PCH vibration monitor connected to the same computer.

The scalar values can be analysed directly or exported as a comma-separated file for post analysis.


Time stream of vibration signal (time waveform data)

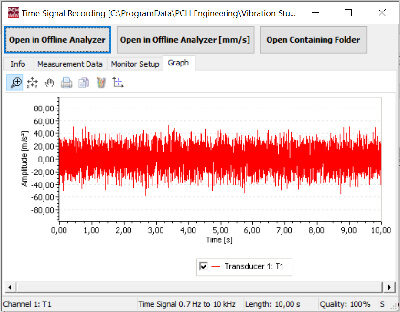
PCH Vibration Studio® offers recording of vibration time signals, which can be saved on the computer or on a memory stick for analysis.

The time signal recording can be stored as documentation for normal operation as base point, or can be emailed to specialists for evaluation.

The data is available as an .scv file for import to third-party software as well.

Depending on the type of PCH vibration monitor, the time stream can record up to 10 kHz (if supported by the vibration monitor). 


Offline FFT diagnostic and analysis tool

After recording a time signal you can analyse the data in the complementary, offline FFT-, Envelope-, and Cepstrum Analyzer.

The Spectrum Analyzer offers cursors for main, harmonics, side band and delta, free Zoom within the recorded frequency range, up to 256,000 lines.

Other tools like linear averaging of up to 1024 spectra as well as time windows like Hanning, Blackman, Flat Top and Rectangular are available.

In the time waveform, the user can create pre-filters with cut-off frequencies and select the amount of samples to analyse.

Up to 10 spectrum plot markers can be set for easy checks of critical frequencies with user defined colors and names for up to 10 frequencies.

The marker setups can be stored in setup files to be reloaded with other recorded time signals.


Copyright © PCH Engineering A/S - All Rights Reserved.

webpage.io Content Management System.


HTML5 | CSS3